

If you have worked in cybersecurity for several years, you have likely experienced an information security incident that felt like a crisis. In such situations, multiple activities need to be managed simultaneously. While the incident itself must be investigated and contained, stakeholders such as the Board of Management or regulators often request immediate answers to a key question: “How severe will it be?”
A good example for such a crisis was the MKS Instruments ransomware incident in 2023 that forced the company to shut down key IT systems supporting order processing, manufacturing, and shipping of their chips production infrastructure to semiconductor manufacturers. As a result, operations across multiple business units were disrupted, and the company temporarily halted production while initiating containment and recovery measures. The company later disclosed an estimated revenue impact of around $200 million related to this disruption.
At an early stage of such an incident, a complete picture is typically not available. The business impact and associated financial costs only become clearer over time. Determining the total financial loss of a major incident can take months or even years, particularly in the case of data privacy breaches.
The top-down cyber risk quantification methodology of Squalify can support the estimation and management of the financial impact throughout the lifecycle of a large cyber incident.
The “Large Incident Assessment” dashboard is structured into three components:
- Incident description
- Financial estimation & impact evaluation
- Monitoring & reporting
This structure is used in this blog post to illustrate how loss estimations evolve over time and how the dashboard can be used for professional crisis management and reporting.
Incident description – Status quo details over time

The first section provides high-level information describing the incident for a non-technical audience and highlights the most important assumptions and input data used for quantification. Users can select different quantification dates, demonstrating how confidence in the input data increases the certainty of the quantification results over time.
In the initial estimation, much of the required data is typically unavailable and must be estimated. With each subsequent quantification, additional information becomes known and uncertainty decreases. In the example illustrated in the graph, the third quantification takes place after business interruption has concluded, while the recovery phase is still ongoing. Production downtime and capacity reduction are fully known at this point, whereas data related to make-up capabilities remains uncertain.
This approach increases transparency around the quantification inputs and results, supporting clearer communication and trust in the results.
Financial estimation & impact evaluation
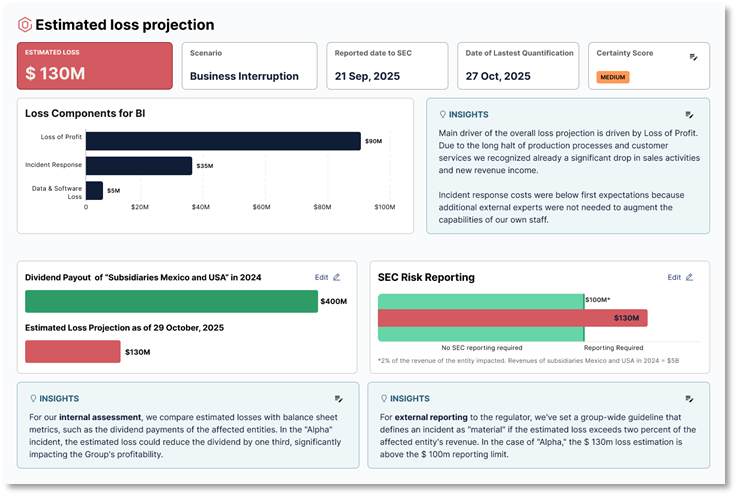
This section presents the quantification results as of the selected quantification date. It begins with key result metrics, including estimated loss, quantification date, and certainty levels. The estimated total loss is also broken down into individual components. In the example of a business interruption event, these include loss of profit, incident response costs, and expenses related to rebuilding software and data.
The next part places the estimated loss into both internal and external context to support interpretation by non-technical stakeholders. In this example, the company compares the estimated loss with the dividend paid in the previous year. This comparison provides an internal reference point and helps inform decisions about communication with stakeholders such as the supervisory board or shareholders.
The dashboard also considers regulatory requirements. Because the example company is regulated by the SEC, it must report a “material incident” within 72 hours. To operationalize this requirement, the company had defined a materiality threshold of 2% of revenue for the affected entity. The “SEC Risk Reporting” chart visualizes whether the estimated loss exceeds this threshold and triggers reporting obligations.
Monitoring & reporting
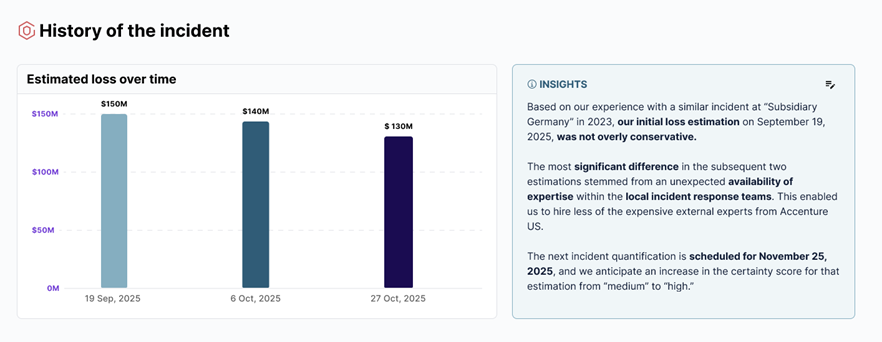
The final section provides an overview of loss estimations across multiple quantification dates. As understanding of the incident improves, estimation results typically change over time.
In this example, the estimated loss decreases across successive quantifications. This pattern is common: early-stage estimates often reflect higher uncertainty and tend to be more conservative, while later estimates are based on more complete and reliable input data.
Summary
The “Large Incident Assessment” dashboard illustrates how cyber risk quantification from Squalify can support CISOs in estimating financial losses during a severe cyber crisis using a structured and transparent approach. The dashboard visualizes how loss estimations evolve throughout the lifecycle of a major incident. By organizing information into incident description, financial evaluation, and ongoing monitoring, the dashboard increases transparency around assumptions, contextualizes potential impact, and tracks changes as more information becomes available. This supports consistent and trustful communication with stakeholders while the incident is being investigated and managed. In addition, integration of this approach into a crisis plan increases the level of resilience and professionalism.