

For security and risk leaders, a credible cyber risk model is the foundation for making defensible business cases in the boardroom; where strategic decisions and budgets are determined and cyber risk translates into business language.
The Squalify platform leverages Munich Re’s risk model, the same one used by the cyber reinsurer to assess cyber risk across thousands of companies. Continually refined to reflect the evolving cyber threat landscape, the model requires minimal input thanks to its top-down insurance-based approach yet embeds extensive expertise within its parameters.
Here’s an overview of how the model works and why you can trust it.
Why trust the Squalify model?
The Squalify model is built on a wealth of loss data from companies, spanning 130 industries in 80 countries and over a decade of cyber insurance expertise, applied to quantify financial impact across thousands of organizations.
Unlike bottom-up models that attempt to map every system or asset, the Squalify model applies a top-down approach, which enables you to work with limited input data and tight deadlines. A method adopted from the work of insurers. Instead of focusing on technical details, it draws on real-world loss experience, identifying correlations between losses, firmographics, and security factors that shape the model’s parameters.
The model is not overly complex, requires only limited data from your side and will provide valuable and tangible insights. For your day-to-day business, this approach means faster, leaner, and still accurate results to underpin strategic risk decisions.
How the model tailors results to your company
The Squalify model individualizes calculations to your company. It uses your exposure profile based on firmographics to select parameters at each step of the calculation instead of applying generic averages. Input information entered by the corporation, which is used to tailor parameters include, but are not limited to:
- Industry – attack frequency and severity vary widely by sector.
- Revenue – size largely impacts the scale of losses.
- Geography – different legal frameworks drive different regulatory penalties and thus the severity.
- Data profile – exposure to critical privacy data increases privacy-related costs.
- Security maturity – stronger defenses reduce severity and frequency of outcomes.
The parameter database is continually updated, incorporating new threats, fresh incident data, and lessons learned from loss experience. Parameters are recalibrated regularly with expert input from cyber specialists across the global Munich Re network. For more information on high-quality data use in the model, read the following blog post.
The result: your quantification reflects an individualized view of your organization within the current cyber threat landscape.
How the model works: Cause, cost, consequence
Cyber incidents are unpredictable. They vary not only in likelihood but also in scale - from minor outages to catastrophic, business-interrupting events and large-scale data breaches. To capture this uncertainty, the Squalify model runs a Monte Carlo simulation, a method used across finance and insurance to simulate millions of possible futures when no single “correct” outcome exists.
For every company, the model simulates 1 million business years based on your input information and is paired with hundreds of parameters selected by the system for your risk profile. In each simulated year, it walks through three stages building a full statistical picture of your cyber risk. The result is a severity distribution used to extract different financial loss values for different probabilities.
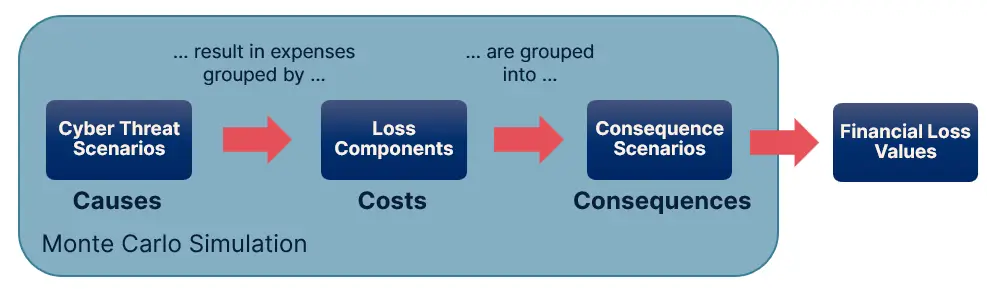
1. Cyber Threat Scenarios – what could happen
First, the model considers whether a cyber threat scenario occurs. Cyber threat scenarios are grouped cyber threats, each covering a certain similar pattern of known risks. The cyber threat scenarios are pre-built and maintained in the model - there is no need to self-create scenarios. The characteristics of the pattern include, but are not limited to:
- The threat agent (e.g., an internal or external threat actor)
- The intention (e.g., intentional or accidental)
- The type of compromise (e.g., integrity, confidentiality, availability)
By grouping incidents into cyber threat scenarios, each with its own frequency (how often it tends to occur) and severity (how damaging it tends to be), the model mirrors real-world attack patterns.
In each simulated year, the first question is: did this cyber threat scenario occur? The answer is determined by the cyber threat scenario’s frequency parameters, which are specified to your firmographics. Of course, not every year will result in a loss.
2. Loss Components Triggered – what costs follow
If a scenario does occur, the model calculates the financial impact by looking at which types of costs typically arise in every cyber threat scenario. These costs are grouped as Loss Components considering, for instance, incident response costs or loss of profit. Each reflects the expenses typically seen in real-life incidents. The model considers how likely they arise and how severe those costs could be. This is done in two steps, repeated for every single simulation:
- Which Loss Components are triggered?
Not all costs will occur every time. For example, a data breach may often include regulatory fines and notification costs, but not every incident will lead to cyber extortion costs. Based on probabilities, the model determines: for this cyber threat scenario, which of the possible Loss Components will incur costs in this particular simulation run? - How severe are the costs for each Loss Component?
When a Loss Component is triggered, the model then determines its severity. This is not a fixed number but a statistical range, represented as a severity distribution. This output gives a statistical severity range for losses, adjusted based on your organization’s information security maturity. Stronger information security controls shift the curve toward lower values. Weaker maturity increases the likelihood of extreme losses. The upper boundary of the losses is determined by the Maximum Foreseeable Losses - the worst-case financial loss values specific to your company.
By running this two-step process within each of the 1 million simulations, the model produces a statistically rich picture of expected losses - capturing both everyday events and rare, high-impact outliers.
3. Consequences – what business outcome results
To make results easier to interpret at the board level, the model rolls outcomes of the severity distributions together into three core business consequence categories:
- Data Privacy Breach – sensitive personal data is exposed, deleted, or corrupted.
- Business Interruption – operations and business processes are disrupted.
- Financial Theft & Fraud – financial assets are stolen.
Every loss produced in the simulation feeds into one of these categories. This makes it possible to present results not in abstract technical terms, or in too narrow views on specific threats, but in business impact that leadership understands.
4. Financial Loss Values – how much it costs
Finally, the model orders the values from the severity distribution by size and extracts relevant values to showcase specific financial loss values for every Consequence Scenario.
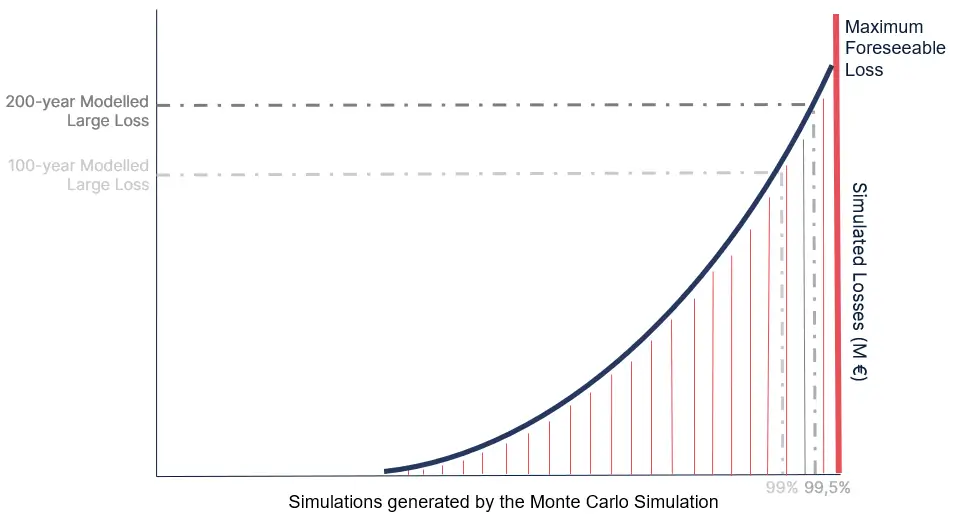
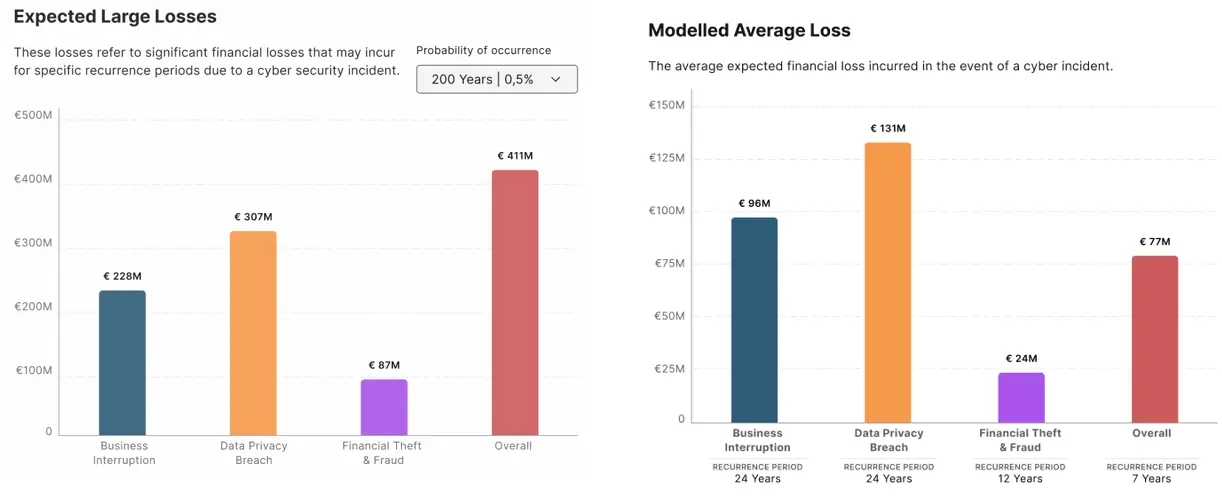
These financial loss values displayed on the Squalify platform include:
- Value-at-Risk (VaR) metrics for 100-, 200-, 500-, and 1000-year events (1%, 0.5%, 0.2%, and 0.1% probability losses).
- Average expected losses and recurrence periods, showing the typical cost if an incident occurs in each consequence category as well as the likelihood.
In addition to the financial loss values, the platform generates further outputs:
- Worst Case loss metrics show the potential losses, if no Information Security controls are held. These values are determined prior to the Monte Carlo simulation and provide the upper boundary of the severity distribution curve.
- Risk Balance Scores show the relationship between the exposure you are facing per Consequence scenario and how well you are protected, based on the maturity of your Information Security.
Conclusion
Quantifying cyber risk doesn’t have to mean guesswork, endless data gathering, or countless threat scenarios. With Squalify, you’re using a methodology that has already proven its worth through numerous cyber risk assessments of large corporations worldwide.
By simulating 1 million business years, grouping incidents into meaningful cyber threat scenarios, mapping them to real cost categories, and rolling results up into clear business consequences, the model delivers defensible financial numbers you can use with your board, insurers and investors.
It’s precise, efficient, and built on real loss data. Most importantly, it connects cyber risk to business impact.